Epidemiological Parameters
This section presents the epidemiological parameters for COVID-19. Their values are stored in covid_epi_params.csv which is also accessible via
params = sid.load_epidemiological_parameters()
Health System
At the moment, the health system is kept simple compared to other components of sid as the focus lies on social mixing patterns in the population.
The only mandatory parameter for the health system is the icu_limit_relative. This
entry gives the number of ICU beds per 100,000 individuals and is a quick way to
implement a limit of the health care system. If the limit is exceeded, patients in ICUs
are randomly picked and their status is set to deceased until the limit is satisfied.
The following line is an exemplary entry for the German health system which provides roughly 40,000 beds for 80,000,000 people which is approximately 50 beds per 100,000 individuals.
category |
subcategory |
name |
value |
|---|---|---|---|
health_system |
icu_limit_relative |
icu_limit_relative |
50 |
References
Testing
sid allows the researcher to implement complex testing strategies which are best explained in the tutorial How to test.
For two of the three stages of testing, allocation and processing, there is a mandatory parameter.
rel_available_tests sets the maximum number of tests which can be distributed each
day per 100,000 individuals.
rel_available_capacity sets the maximum number of tests whose processing can be
started each day per 100,000 individuals.
category |
subcategory |
name |
value |
|---|---|---|---|
testing |
allocation |
rel_available_tests |
0.1 |
testing |
processing |
rel_available_capacity |
0.02 |
A major drawback is that these parameters are only able to implement constant limits. Thus, the tutorial also discusses ways in which the limits can be changed daily to model the preparation and ramp up of existing capacities in a country.
References
Allocated tests and testing capacity in Germany under “Daten zum Download” and “Tabellen zu Testzahlen, Testkapazitäten und Probenrückstau …”.
For the countdown until tests are processed and individuals are informed about whether they have been infected we take data from the ARS RKI data. From November 2020 to February 2021 about a third of tests were processed on the same day, 50% on the next day, 10% within two days. The remaining 7% we collapse to take 3 days. Since countdowns are reduced directly after calculating the tests, we add one to each and arrive at the following distribution:
category |
subcategory |
name |
value |
|---|---|---|---|
cd_received_test_result_true |
1 |
0.33 |
|
cd_received_test_result_true |
2 |
0.5 |
|
cd_received_test_result_true |
3 |
0.1 |
|
cd_received_test_result_true |
4 |
0.07 |
Rapid Tests
To calibrate the sensitivity of rapid tests we rely on this study by Smith et al. (2021).
From this we define five periods:
Before onset of infectiousness, the sensitivity is 0.35 as reported in figure 2.
On the day that infectiousness starts, the sensitivity is 0.88 as reported in table 2.
While a person is infectious, the sensitivity is 0.92 as reported in figure 2.
After infectiousness stops, the sensitivity is 0.5 until 10 days after the start of infectiousness as can be conluded from figure 2 and table 2.
If it has been more than 10 days since the onset of infectiousness, rapid tests are negative.
For the specificity we assume 99.4% which is in line with this meta study by Brümmer et al. (2021).
Immunity Countdown
Due to the novelty of COVID-19, no reliable information on the duration of immunity exists yet. However, according to the German RKI people have been reported to develop specific anti bodies within two weeks of infection and evidence from the related SARS and MERS viruses suggest immunity of up to 3 years. Note, however, that there have also been case reports of reinfection sid supports both heterogeneous, stochastic and no lasting immunity so we can check how different immunity patterns affect our results. As baseline we set the length of immunity to 1,000 days (2.7 years) for all individuals.
Countdown from Infection to the Begin of Infectiousness
The period between infection and onset of infectiousness is called latent or latency
period. The corresponding countdown is called cd_infectious_true.
However, the latency period is rarely given in epidemiological reports on COVID-19. Instead, scientists and agencies usually report the incubation period, the period from infection to the onset of symptoms. A few studies used measurements of virus shedding to estimate infectiousness during the course of the disease. When measurements started before the onset of symptoms the development of the viral load before symptoms gives us an indication of number of days between the onset of infectiousness and symptoms.
The ECDC (2020-06-24, question 5) gives a period of 1-2 days between the onset of infectiousness and the onset of symptoms. This is in line with a study published in Nature which estimates the onset of infectiousness at 2.3 days (CI: 0.8–3.0 days) before symptoms. This also aligns with a study published in the Lancet.
Estimates of the incubation period usually give a range from 2 to 12 days. A meta-analysis by McAloon et al. (2020-07-23) comes to the conclusion that “The incubation period distribution may be modelled with a lognormal distribution with pooled \(\mu\) and \(\sigma\) parameters (95% CIs) of 1.63 (95% CI 1.51 to 1.75) and 0.50 (95% CI 0.46 to 0.55), respectively.”
We discretize the incubation period as follows:
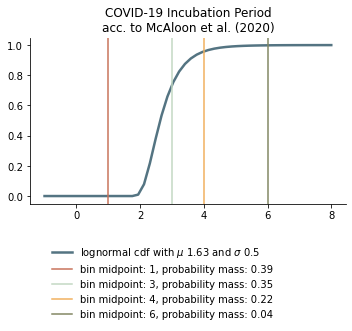
To arrive at the latency period we abstract 1 from each of these, except for the one that is one due to technical reasons.
Note
Technical explanation: This is because countdowns are reduced by one before they cause changes when reaching zero, i.e. if a countdown “starts” at zero it will not have an effect while a countdown of one will take effect at the end of the current period (i.e. after individuals meet).
We do not separate between age groups as He et al. (2020-04-15) do not report differences in viral loads across age groups and disease severity.
However, calculating back from the symptomatic cases leaves the case of asymptomatic cases unclear. To our knowledge no estimates for the latency period of asymptomatic cases of COVID-19 exist. We assume it to be the same for symptomatic and asymptomatic cases.
Thus, we arrive at the following lengths for the latency period:
days until infectiousness starts |
probability |
|---|---|
1 |
0.39 |
2 |
0.35 |
3 |
0.22 |
5 |
0.04 |
Duration of Infectiousness
The countdown for the time period during which an individual is infectious is called
cd_infectious_false.
We assume that the duration of infectiousness is the same for both symptomatic and asymptomatic individuals as evidence suggests little differences in the transmission rates of corona virus between symptomatic and asymptomatic patients and that the viral load between symptomatic and asymptomatic individuals are similar (see also Singanayagam et al. (2020-08-13) and Byrne et al. (2020-07-10)).
Our distribution of the duration of infectiousness is based on this meta analysis by Byrne et al. (2020-07-10).
For symptomatic cases they arrive at 0-5 days before symptom onset (figure 2) and 3-8 days of infectiousness afterwards. (Viral loads may be detected much later but 8 days seems to be the time after which most people are culture negative, as also reported here.) Thus, we arrive at 0 to 13 days as the range for infectiousness among individuals who become symptomatic (see also figure 5). This duration range is very much in line with the meta-analysis’ reported evidence for asymptomatic individuals (see their figure 1).
Following this evidence we assume the following discretized distribution of the infectiousness period.
duration of infectiousness |
probability |
|---|---|
3 |
0.1 |
5 |
0.25 |
7 |
0.25 |
9 |
0.2 |
11 |
0.2 |
Length of the Presymptomatic Stage
The presymptomatic stage is the time between the onset of infectiousness and the onset
of symptoms. The corresponding countdown is called cd_symptoms_true.
As we used the incubation time (the time from infection to symptoms) to calculate the
latency period, the length of cd_symptoms_true follows mechanically from the
estimated number of days by which infectiousness precedes symptoms. In the case of
COVID-19 we assume that the countdown is either 1 or 2 for symptomatic courses of the
disease. This is in agreement with the composite inferred model on the infectiousness
period by the meta-analysis for the infectiousness period (figure 5).
However, a significant share of infected and infectious individuals never develop symptoms. We use data by Davies et al. (2020) to get an age dependent probability of becoming symptomatic. The probability of developing symptoms varies between 25% for children and young adults to nearly 70% for the elderly.
We split the remaining probability mass evenly between 1 and 2 days, which is the length of the presymptomatic stage:
Duration of Symptoms
We use the duration reported by Bi et al. (2020-03-19, Figure S3, panel 2) to recovery of mild and moderate cases that we assume to not require intensive care as estimates for the duration of symptoms and infectiousness for asymptomatic and non-ICU cases.
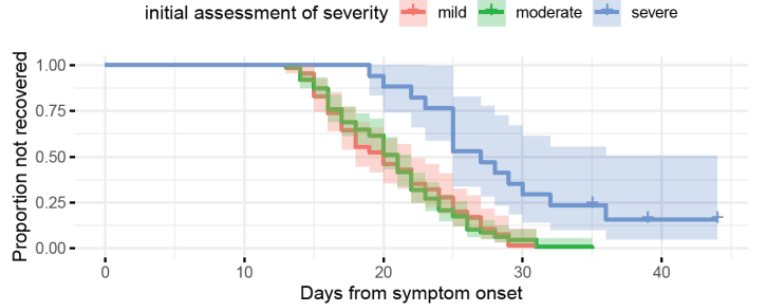
We collapse the data to the following distribution:
days until recovery |
probability |
|---|---|
15 |
0.1 |
18 |
0.3 |
22 |
0.3 |
27 |
0.3 |
These long symptom durations align with reports by the CDC.
These numbers are only used for mild cases. We do not disaggregate by age. Note that the the length of symptoms is not very important in our model given that individuals stop being infectious before their symptoms cease.
Time from Symptom Onset to Admission to ICU
The data on how many percent of symptomatic patients will require ICU is pretty thin. We rely on data by the US CDC and the OpenABM-Project (2020-09-14).
In the OpenABM project, the fraction of asymptomatic individuals (\(P(\text{Not Symptomatic})\)), the fraction of individuals needing to be hospitalized (\(P(\text{H})\)) and the fraction of hospitalized cases requiring ICU (\(P(\text{ICU}|\text{H})\)) are given.
Thus, the percentages of symptomatic individuals who will require intensive care is
To calculate this we need to go from the fraction of infected individuals needing hospitalization to the fraction of symptomatic individuals needing hospitalization. Assuming that only symptomatic individuals need hospitalization we can use the definition of the conditional probability:
Thus,
Calculating this for each age group we arrive at the following probabilities of requiring intensive care.
age group |
probability CDC |
probability OpenABM |
|---|---|---|
0-9 |
0.007 |
0.00005 |
10-19 |
0.004 |
0.00030 |
20-29 |
0.005 |
0.00075 |
30-39 |
0.009 |
0.00345 |
40-49 |
0.0015 |
0.01380 |
50-59 |
0.025 |
0.03404 |
60-69 |
0.067 |
0.10138 |
70-79 |
0.166 |
0.16891 |
80-100 |
0.287 |
0.26871 |
Warning
The CDC’s reported age gradient is very small. Only 3.6% of individuals over 80 years old require intensive care. While the death rate is 28.7%. This seems to stem from the ICU share assuming no ICU for those where ICU information is missing. We therefore use the maximum of the death and ICU rate.
The two sources align very well. We take the OpenABM data rounded to whole percent.
For those who will require intensive care we follow Chen et al. (2020-03-02) who estimate the time from symptom onset to ICU admission as 8.5 +/- 4 days.
This aligns well with numbers reported for the time from first symptoms to hospitalization: The Imperial College reports a mean of 5.76 with a standard deviation of 4. This is also in line with the durations collected by the RKI.
We assume that the time between symptom onset and ICU takes 4, 6, 8 or 10 days with equal probabilities.
These times mostly matter for the ICU capacities.
Death and Recovery from ICU
We take the survival probabilities and time to death and time until recovery from intensive care from the OpenABM Project. They report time until death to have a mean of 11.74 days and a standard deviation of 8.79 days. Approximating this with the normal distribution, we have nearly 10% probability mass below 0. We use it nevertheless as several other distributions (such as chi squared and uniform) were unable to match the variance. Our discretization can be seen below.
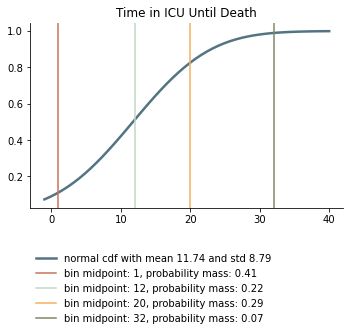
Again, we rescale this for every age group among those that will not survive.
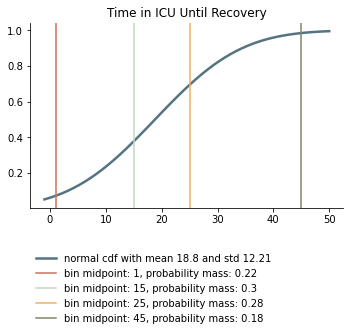
They report time until recovery to have a mean of 18.8 days and a standard deviation of 12.21 days. Approximating this with the normal distribution, we have over 5% probability mass below 0. Our discretization can be seen below.